Trend Analysis · 12 min read
The industry in seven years
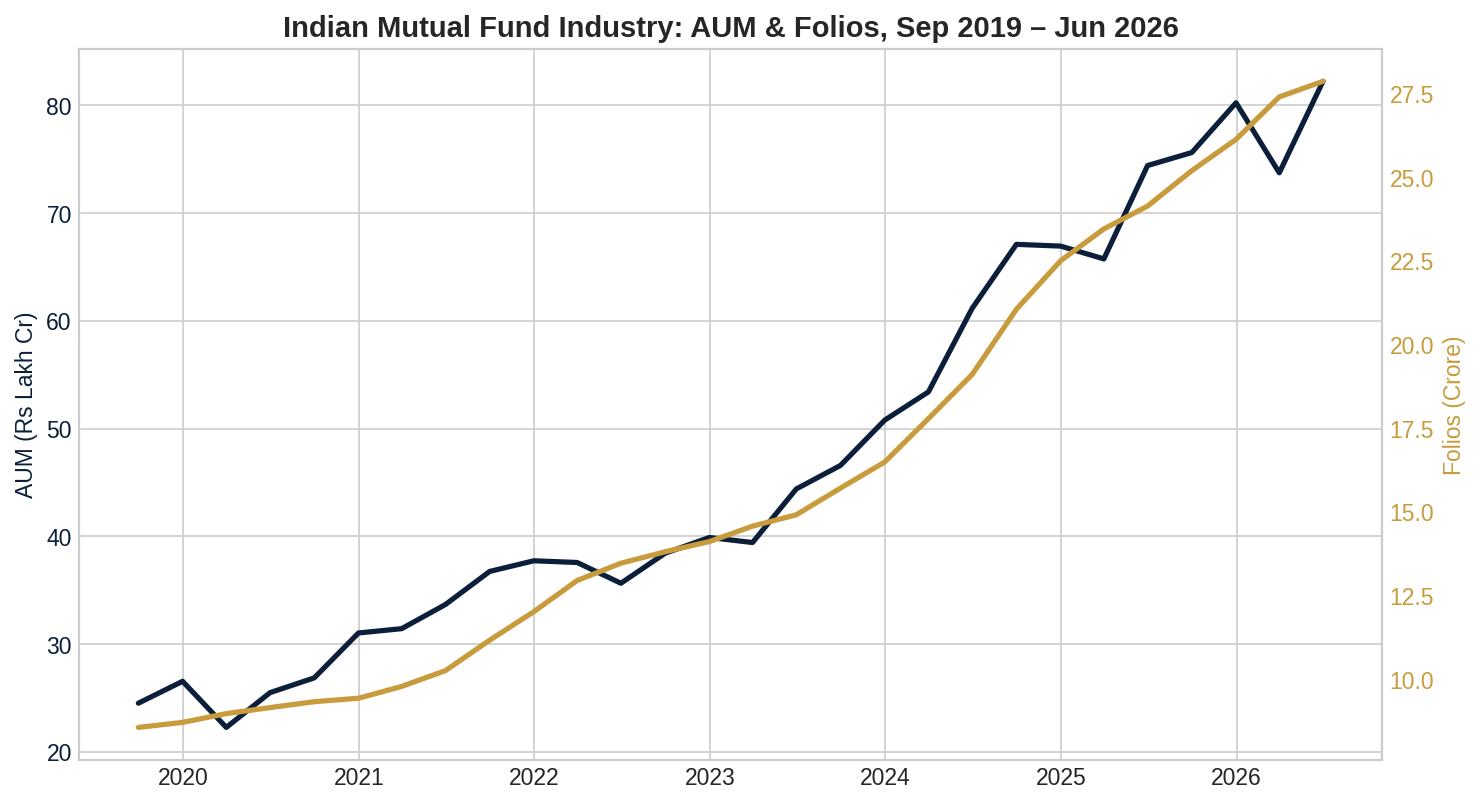
Between September 2019 and June 2026, India's mutual fund industry grew from ₹24.5 lakh crore to ₹82.2 lakh crore in AUM — a 235% increase. Folio count grew almost identically, from 8.56 crore to 27.86 crore, up 225%.
The average amount held per folio, meanwhile, barely moved: ₹2.86 lakh in Sep-2019 to ₹2.95 lakh in Jun-2026, just +3.1%. When AUM and folios grow at nearly the same rate while the average account size stays flat, the growth story is unambiguous: this is almost entirely new investors joining, not existing investors putting in dramatically more money. Seven years of mutual fund growth in India has been a story of democratization, not concentration.
The sharpest quarterly AUM decline in the dataset was the COVID crash (Mar-2020, -16.1%), unsurprisingly. The next-sharpest was much more recent — Mar-2026, -8.1% — consistent with the broader global risk-off period covered elsewhere on this site (see Rupee @ 90 and the recent Weekly notes on India's underperformance versus developed markets).
Where the money actually sits
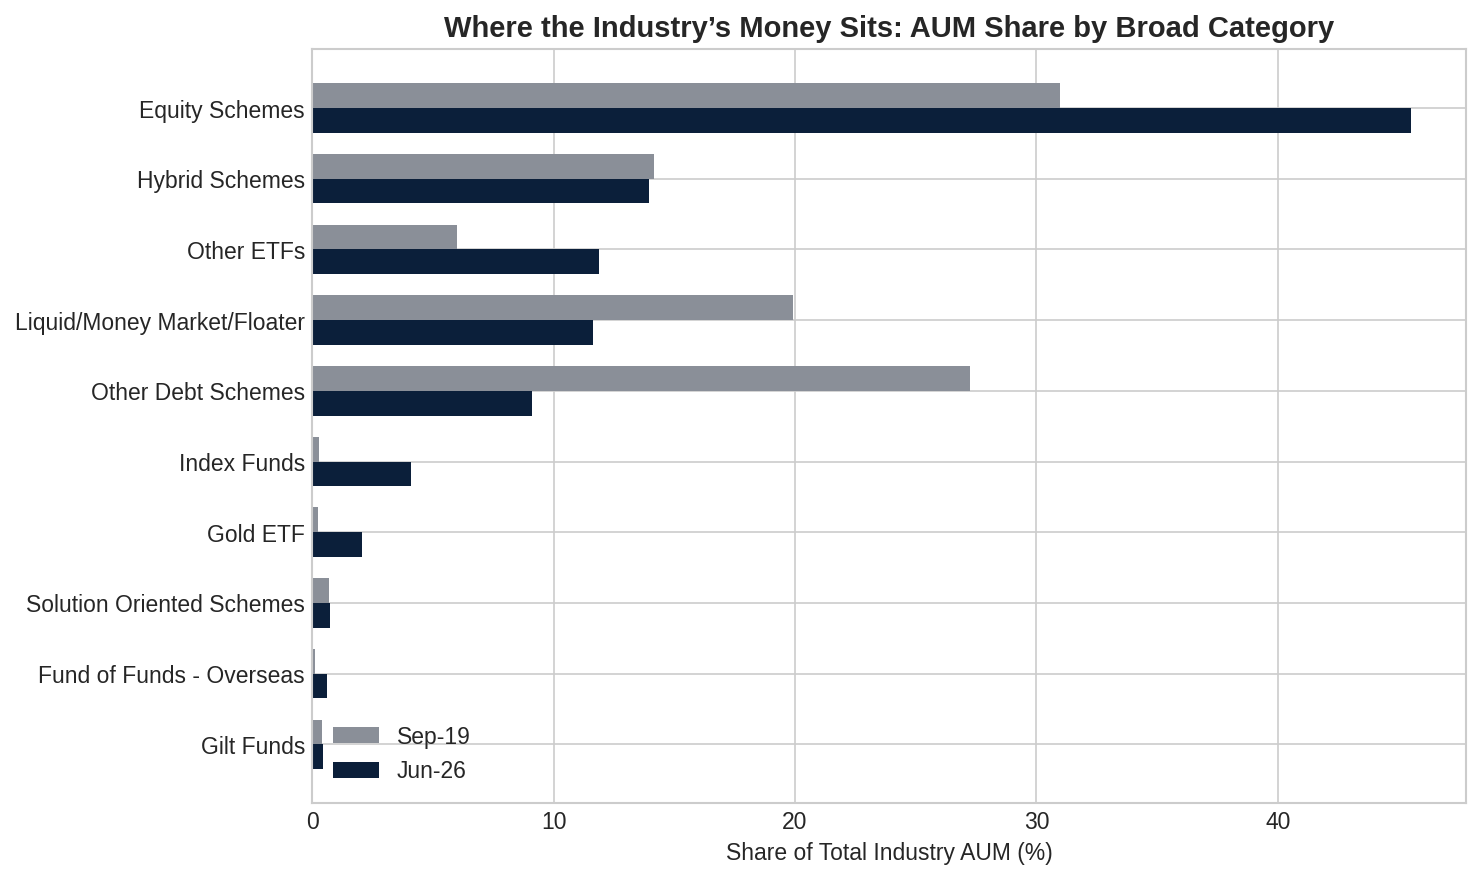
Looking at the broad category structure of the industry over the full seven years, a clear rotation shows up:
| Category | Share Sep-19 | Share Jun-26 | Change |
|---|---|---|---|
| Equity Schemes | 31.0% | 45.5% | +14.5pp |
| Other ETFs | 6.0% | 11.9% | +5.9pp |
| Index Funds | 0.3% | 4.1% | +3.8pp |
| Gold ETF | 0.2% | 2.1% | +1.8pp |
| Hybrid | 14.2% | 13.9% | roughly flat |
| Liquid/Money Market | 19.9% | 11.6% | -8.3pp |
| Other Debt Schemes | 27.2% | 9.1% | -18.1pp |
This is a structural rotation out of debt and liquid parking and into equity, passive funds, and gold — not a shuffle within debt, but a genuine flight of share toward growth and diversification assets. "Other Debt Schemes" is the only category to lose folios outright in absolute terms (-9.6%), not just share.
From a small base, the fastest multiples: Index Funds +5,027%, Gold ETF +2,931%, Overseas Funds of Funds +2,051% — the passive, gold, and global-diversification boom in three numbers.
Gold ETFs: price rally, or new money?
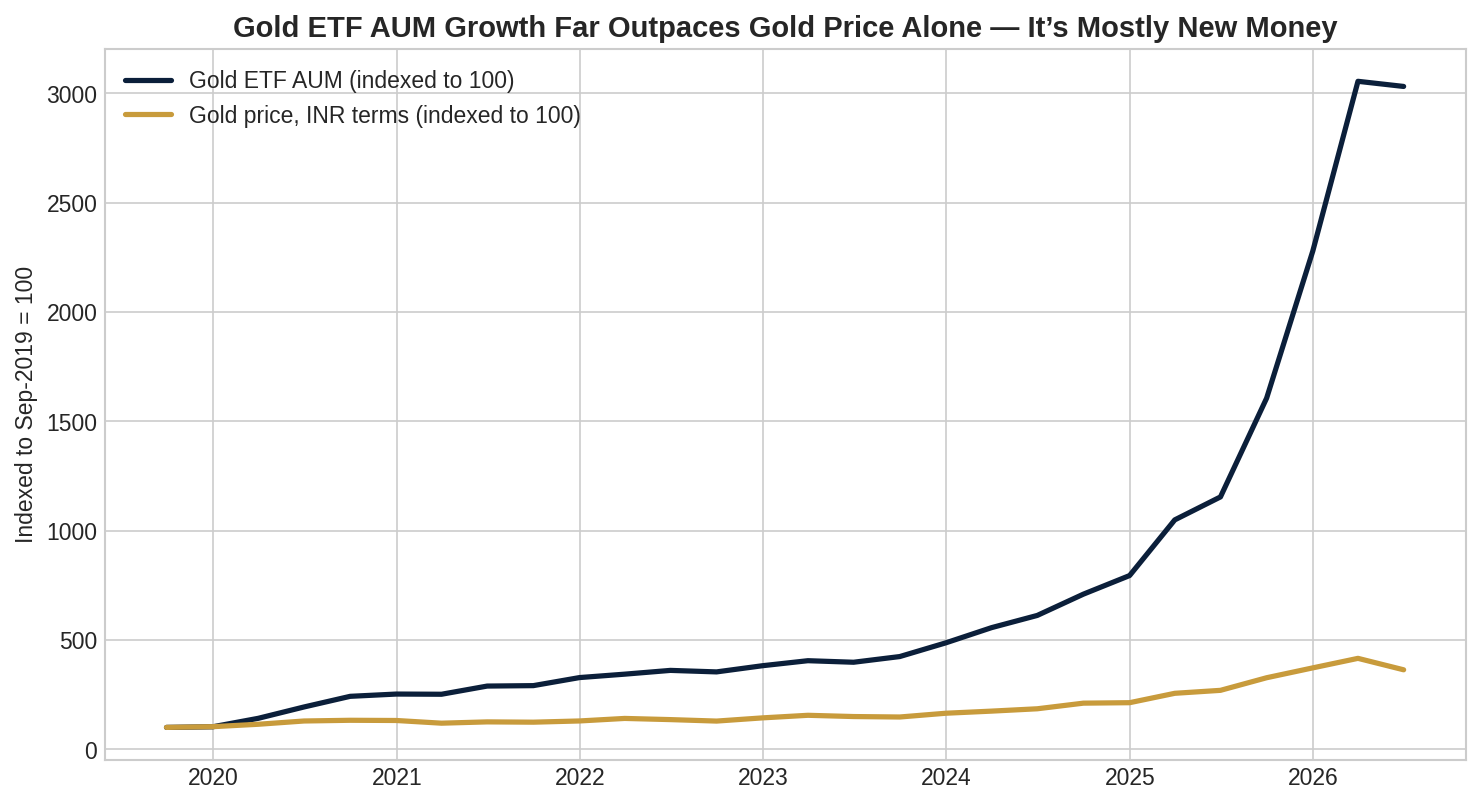
Gold ETF AUM grew +2,931% over the period — but how much of that is investors' existing gold holdings simply becoming more valuable, versus fresh money actively choosing gold? Gold's own price move over the same window: +171.2% in USD terms, +263.4% in INR terms (factoring in the rupee's own slide from ~70.6 to ~94.7 against the dollar).
Price appreciation alone explains only a fraction of the AUM growth — AUM grew roughly 8x more than the gold price itself did. This isn't "existing gold holdings became more valuable" — it's overwhelmingly new investor money actively flowing into gold as an asset class, a genuine behavioral shift rather than a passive price-appreciation artifact.
Inside equity's recent move: mid and small cap lead
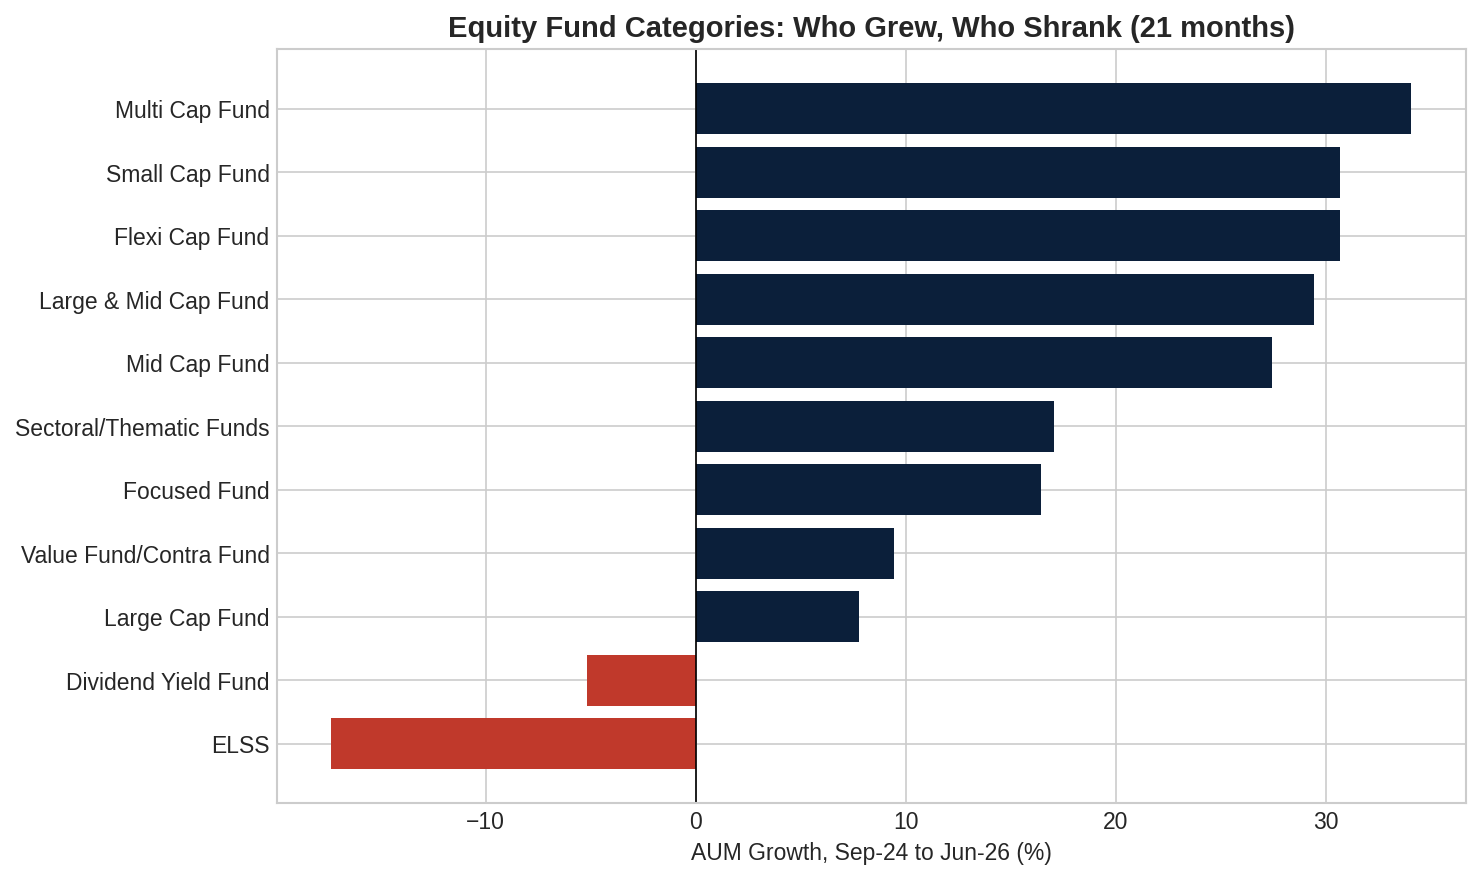
AMFI only began reporting at the detailed scheme-type level from September 2024 — before that, categories like "Small Cap Fund" were lumped into one coarse "Growth/Equity Oriented Schemes" bucket. So this next comparison covers 21 months (Sep-24 to Jun-26), not the full seven years.
- Multi Cap +34.1%, Small Cap +30.7%, Flexi Cap +30.7%, Large & Mid Cap +29.4%, Mid Cap +27.5% — broad-based strength across mid and small-cap-leaning categories.
- Large Cap only +7.8% — the clear laggard among equity categories.
- ELSS -6.2% to -17.4% across its two reporting lines — plausibly linked to the newer tax regime reducing Section 80C's pull, though this dataset alone can't confirm that as the cause.
Debt tells a duration-avoidance story over the same window: Money Market +35.5%, Liquid +29.8%, Overnight +18.8%, while Long Duration fell -31.3% and Fixed Term Plans fell -53.9% — consistent with investors avoiding rate risk during a period of elevated global yields (see What Bond Yields Tell Us About Debt Funds). Hybrid funds show the gold story again from a different angle: Multi Asset Allocation Funds (which blend equity, debt, and gold) nearly doubled, +99.2%.
Who actually owns each fund category?
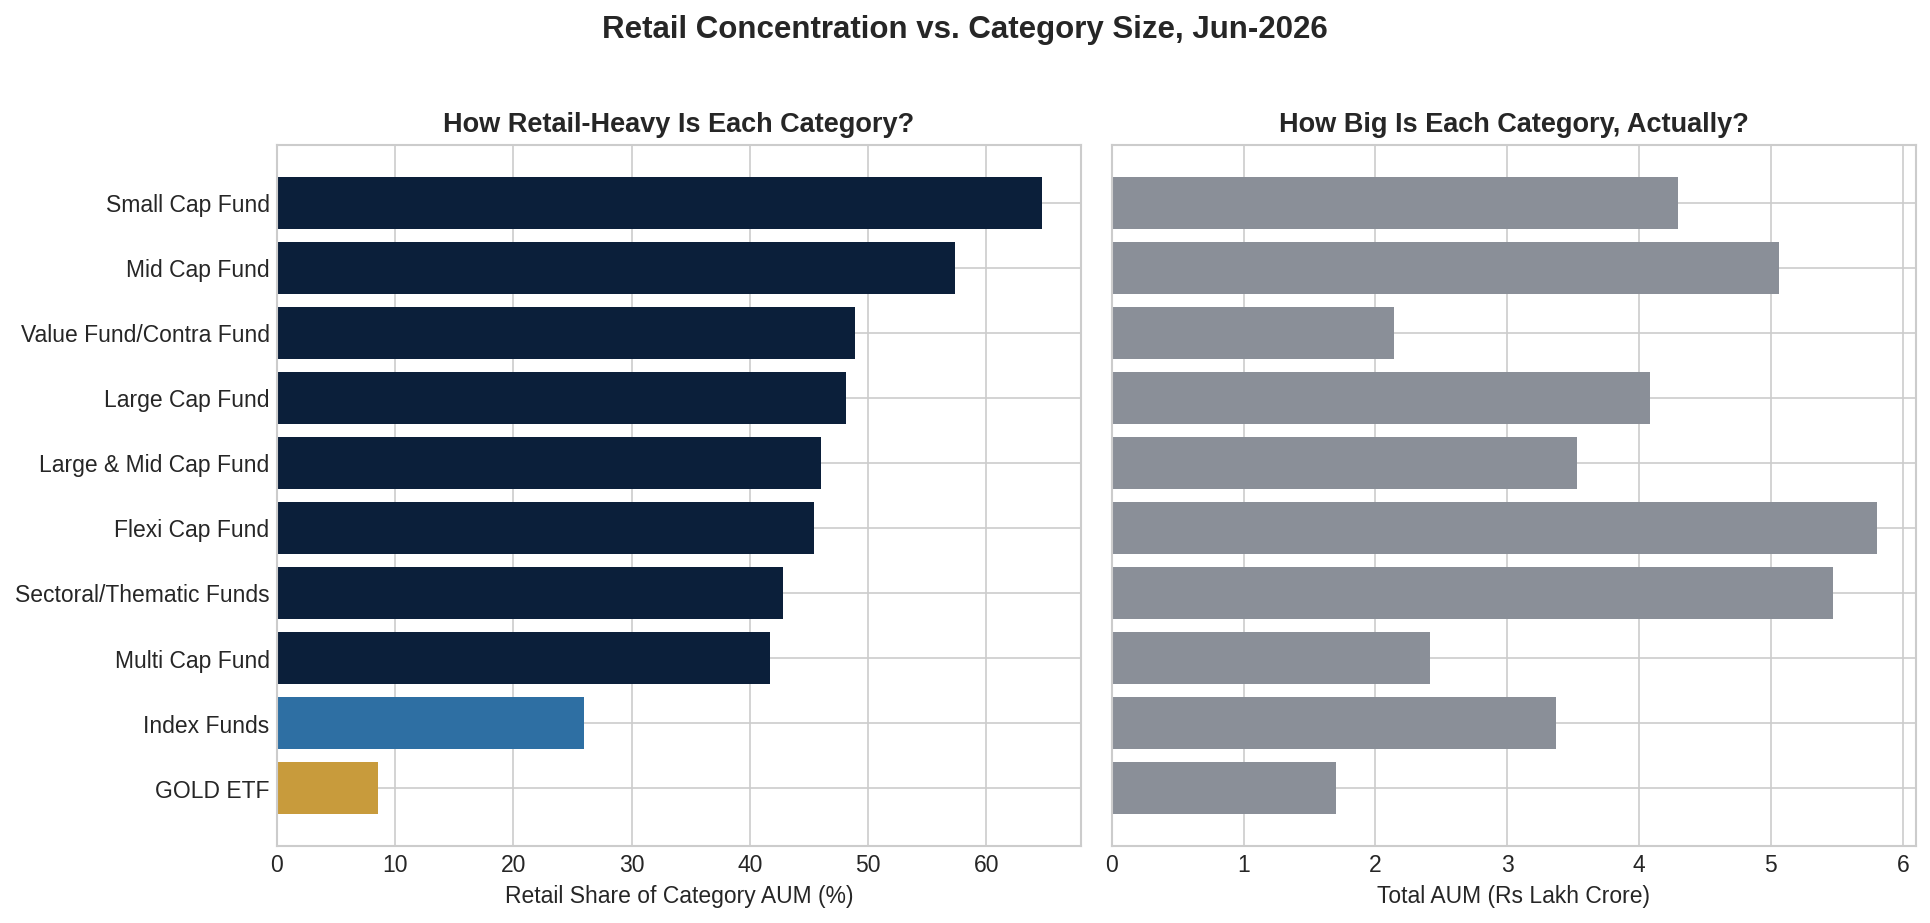
Cross-referencing investor type against fund category (latest quarter, Jun-2026) reveals a clean, intuitive gradient — and two findings that cut against popular assumptions.
| Scheme Type | Retail | HNI | Corporates |
|---|---|---|---|
| Small Cap Fund | 64.7% | 30.3% | 5.0% |
| Mid Cap Fund | 57.3% | 36.1% | 6.5% |
| Value/Contra Fund | 48.9% | 39.0% | 12.0% |
| Large Cap Fund | 48.1% | 38.4% | 13.3% |
| Large & Mid Cap | 46.0% | 42.4% | 11.5% |
| Flexi Cap | 45.4% | 43.4% | 10.6% |
| Multi Cap | 41.7% | 48.8% | 9.3% |
Retail share falls in a near-perfect gradient moving from Small Cap toward Large Cap and blended categories — a 16.6 percentage point gap between Small Cap and Large Cap. This gap is widening, not just present: comparing Sep-24 to Jun-26, Small Cap's retail share rose +1.3pp while Large Cap's fell -1.8pp.
Gold ETFs are a Corporate story, not a retail one. Despite gold's reputation as a household asset in India, Gold ETF AUM is 59.8% Corporates and only 8.6% Retail — and retail's share actually fell further (10.9% → 8.6%) even as the category exploded in size. Combined with the earlier finding that Gold ETF growth is ~8x price appreciation, the real story is corporate treasuries, not households, driving the gold ETF boom.
Index Funds skew away from retail too — only 26.0% Retail versus 35.8% Corporates and 37.9% HNI — though retail's share here is at least rising fast (+6.7pp since Sep-24, the largest mover of any category checked). Retail is catching up to passive investing, just starting from behind.
Debt categories, for contrast, sit in the low single digits for retail almost everywhere (Liquid 2.0%, Money Market 0.8%, Corporate Bond 1.8%) — debt funds remain overwhelmingly a Corporate treasury-management tool.
One more nuance: the categories retail dominates most (Small Cap, Mid Cap) are not the biggest pools of money in absolute terms. Flexi Cap (₹5.81 lakh crore) and Sectoral/Thematic Funds (₹5.47 lakh crore) are both larger than Small Cap (₹4.30 lakh crore) while being meaningfully less retail-concentrated. Retail's influence is strongest in the smaller, higher-risk corners of the industry — the largest pools of money remain more institutionally mixed.
Where retail's own money is actually moving
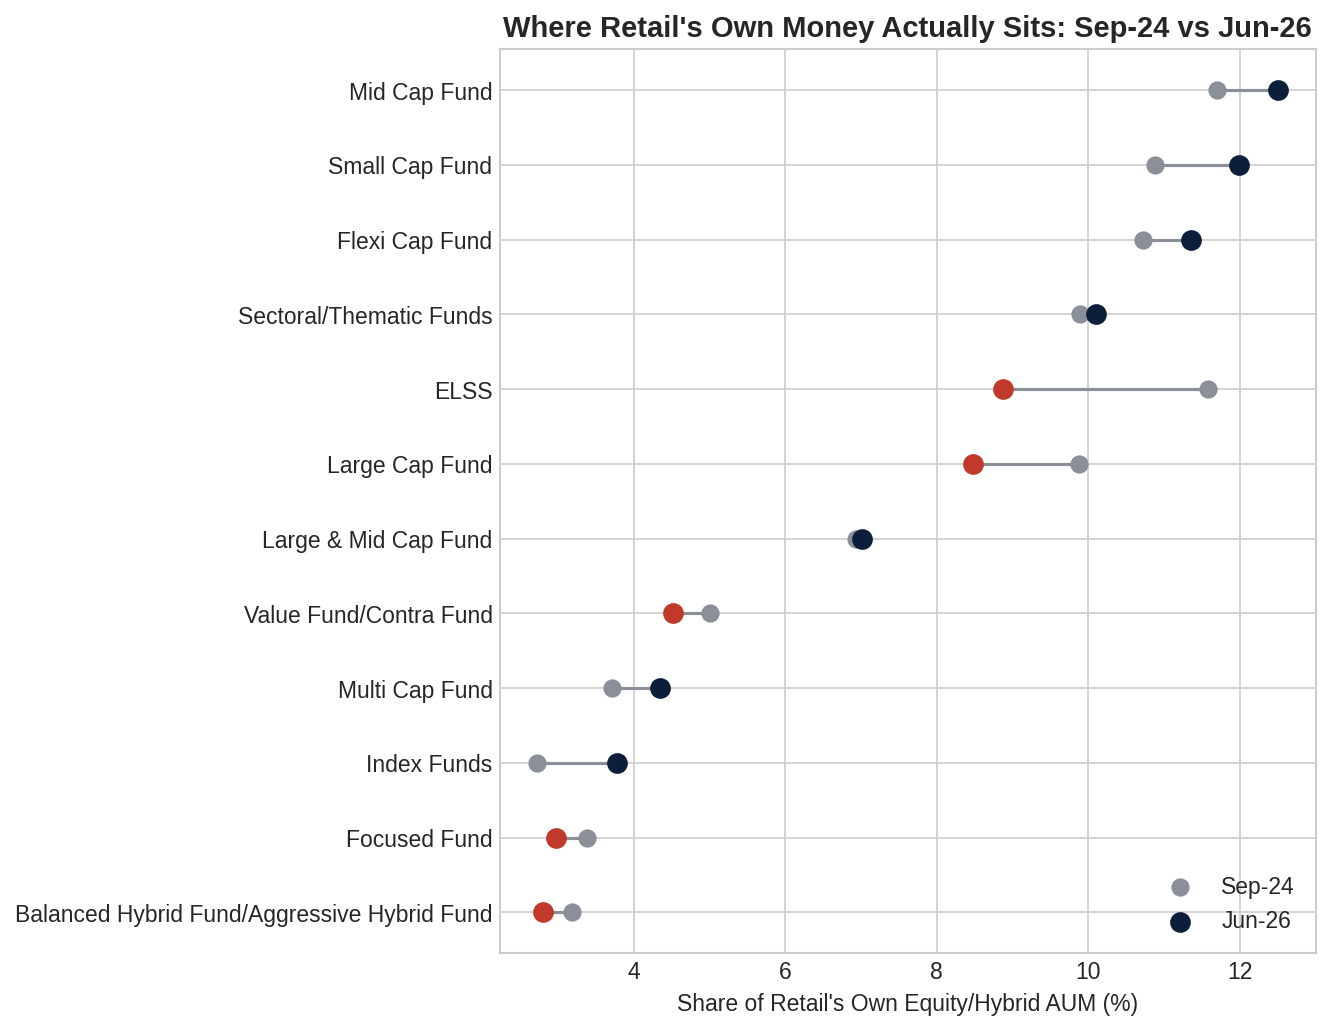
A different cut from the one above: instead of asking who owns each category, this looks purely inside retail's own book — out of Retail's total AUM, what share sits in each category, and how has that mix shifted. Again, the Sep-2024 reporting-format change limits this to a 21-month window rather than the full seven years.
| Scheme Type | Sep-24 | Jun-26 | Change |
|---|---|---|---|
| Mid Cap Fund | 11.71% | 12.51% | +0.81pp |
| Small Cap Fund | 10.88% | 12.00% | +1.12pp |
| Flexi Cap Fund | 10.72% | 11.36% | +0.64pp |
| Sectoral/Thematic | 9.89% | 10.10% | +0.21pp |
| ELSS | 11.59% | 8.87% | -2.71pp |
| Large Cap Fund | 9.88% | 8.48% | -1.40pp |
| Index Funds | 2.72% | 3.77% | +1.05pp |
| Gold ETF | 0.23% | 0.63% | +0.40pp |
Retail money is steadily rotating from Large Cap and ELSS into Mid/Small Cap and Flexi Cap. ELSS's decline is the single biggest mover within retail's own book — again, plausibly tax-regime related, though not something this dataset alone can confirm. Gold ETF's share within retail's own portfolio nearly tripled, but remains under 1% of retail's total — a reminder that even a fast-growing allocation can start from a very small base.
Who's actually in charge here
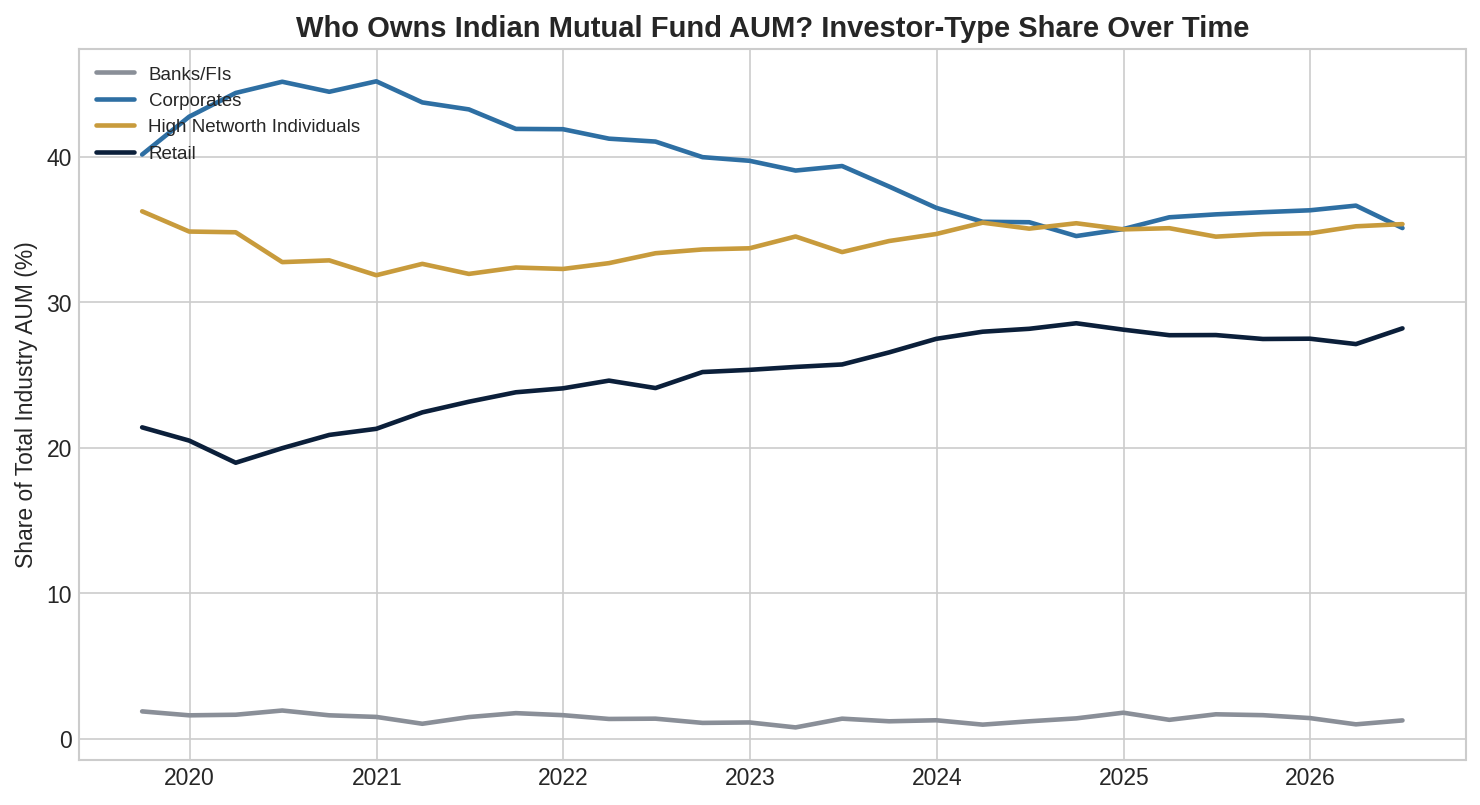
Stepping back to the industry level, ranked by investor type:
| Investor type | AUM share Sep-19 | AUM share Jun-26 | AUM CAGR |
|---|---|---|---|
| Retail | 21.4% | 28.2% | 24.6% |
| HNI | 36.2% | 35.4% | 19.2% |
| Corporates | 40.1% | 35.1% | 17.3% |
| Banks/FIs | 1.9% | 1.3% | 12.8% |
Retail folio share, already dominant, inched up further too: 89.9% to 91.0% of all folios industry-wide. Retail is the fastest-growing investor class in the industry by a wide margin — overtaking Corporates in AUM share around 2024, and now essentially level with HNI. Corporates lost the most ground of any group, -5.1 percentage points.
Is retail actually sticky?
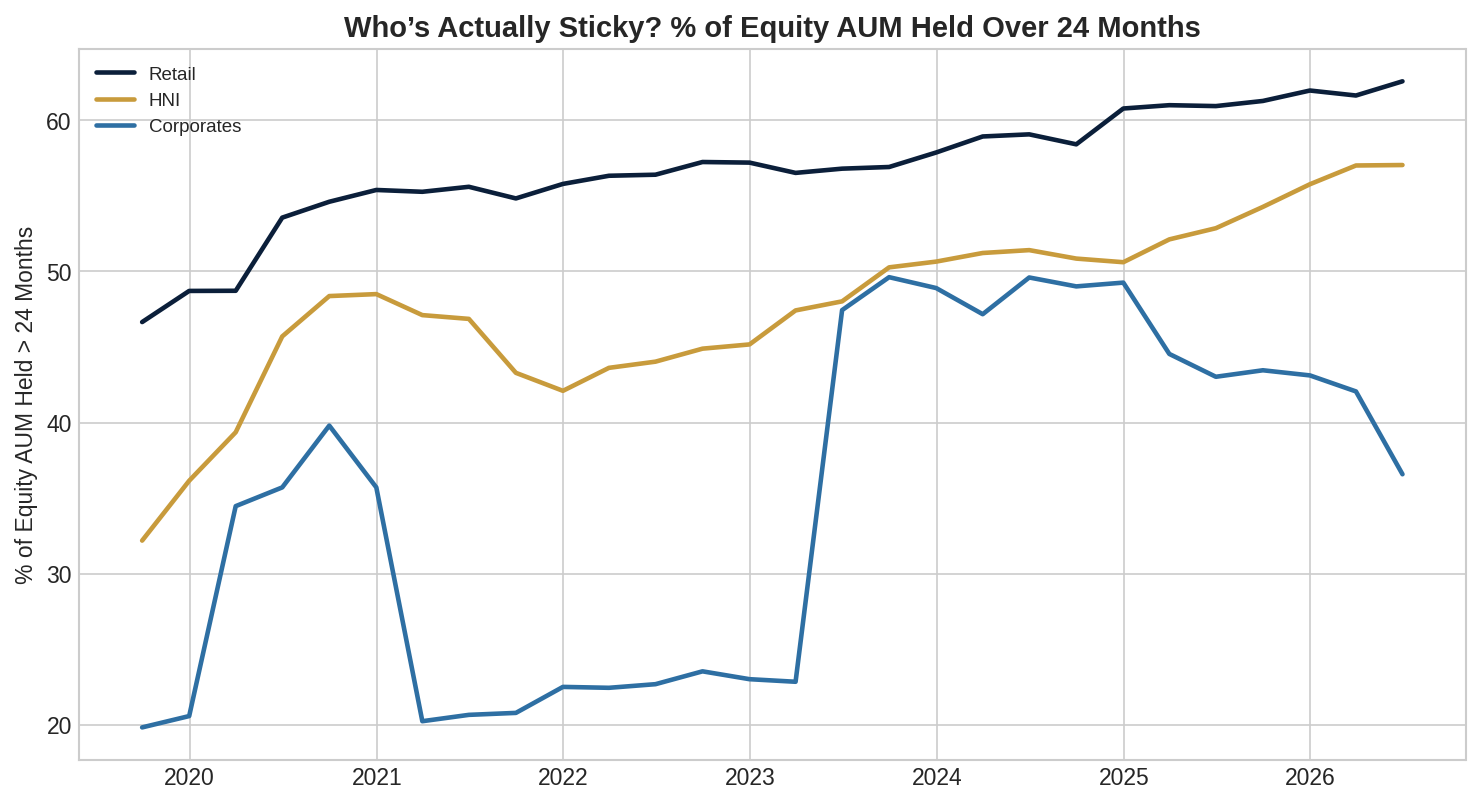
This is where the behavioral story gets concrete. Looking at what share of equity AUM has been held for over 24 months — a reasonable proxy for genuine long-term conviction rather than short-term speculation:
| Investor type | Sep-19 | Jun-26 | Change |
|---|---|---|---|
| Retail | 46.7% | 62.6% | +15.9pp |
| HNI | 32.2% | 57.0% | +24.8pp |
| Corporates | 19.8% | 36.6% | +16.8pp |
Retail's very-short-term churn (the 0-1 month holding bucket) actually fell over the same period — 3.5% to 1.9% of AUM — direct evidence that retail behavior has gotten less trigger-happy, not more, even as the retail investor base has grown much larger and more diverse.
This ties directly back to the scheme-level finding above: retail's rising stickiness isn't a "playing it safe" story. It's happening while retail simultaneously tilts harder toward Small and Mid Cap — historically higher-beta, more volatile categories. Longer holding periods and higher-risk category exposure, at the same time. That's a meaningfully different, more specific claim than simply "retail is maturing."
What this means for investors
- The "retail is dumb money that panics" narrative doesn't hold up in this data. Retail is both the fastest-growing and the most behaviorally stable domestic investor class in the industry, and getting more so, not less.
- Two categories popularly assumed to be retail-driven — Gold and passive/Index Funds — are actually Corporate- and HNI-dominated. If you're benchmarking your own portfolio against "what retail investors do," gold and index funds aren't where that comparison actually holds.
- Corporates behave more tactically than Retail or HNI, and that's not a flaw — it's simply what treasury cash-management money is for, distinct from long-term wealth building.
- The structural shift toward equity, passive funds, and gold, and away from long-duration debt, reflects both a genuine market view (elevated global yields over this period) and a retail base that's increasingly comfortable holding volatility rather than defaulting to "safe" parking instruments.
Educational content, not investment advice.