Trend Analysis · 2 min read
Introduction
In Apr–Jun 2025, Indian mutual funds managed assets worth over ₹33.5 lakh crore in equity schemes alone. Yet beneath this massive pool lies an important story: how investors choose between Large Caps, Mid Caps, and Small Caps depending on markets and sentiment.
This post examines Apr–Jun quarter data across years to decode the interplay of markets, psychology, and data. From the stability of Large Caps to the exuberance of Small Caps, each category reflects a unique behavioral pattern.
Market perspective
Equity mutual funds are central to Indian household portfolios. Within equity-oriented schemes:
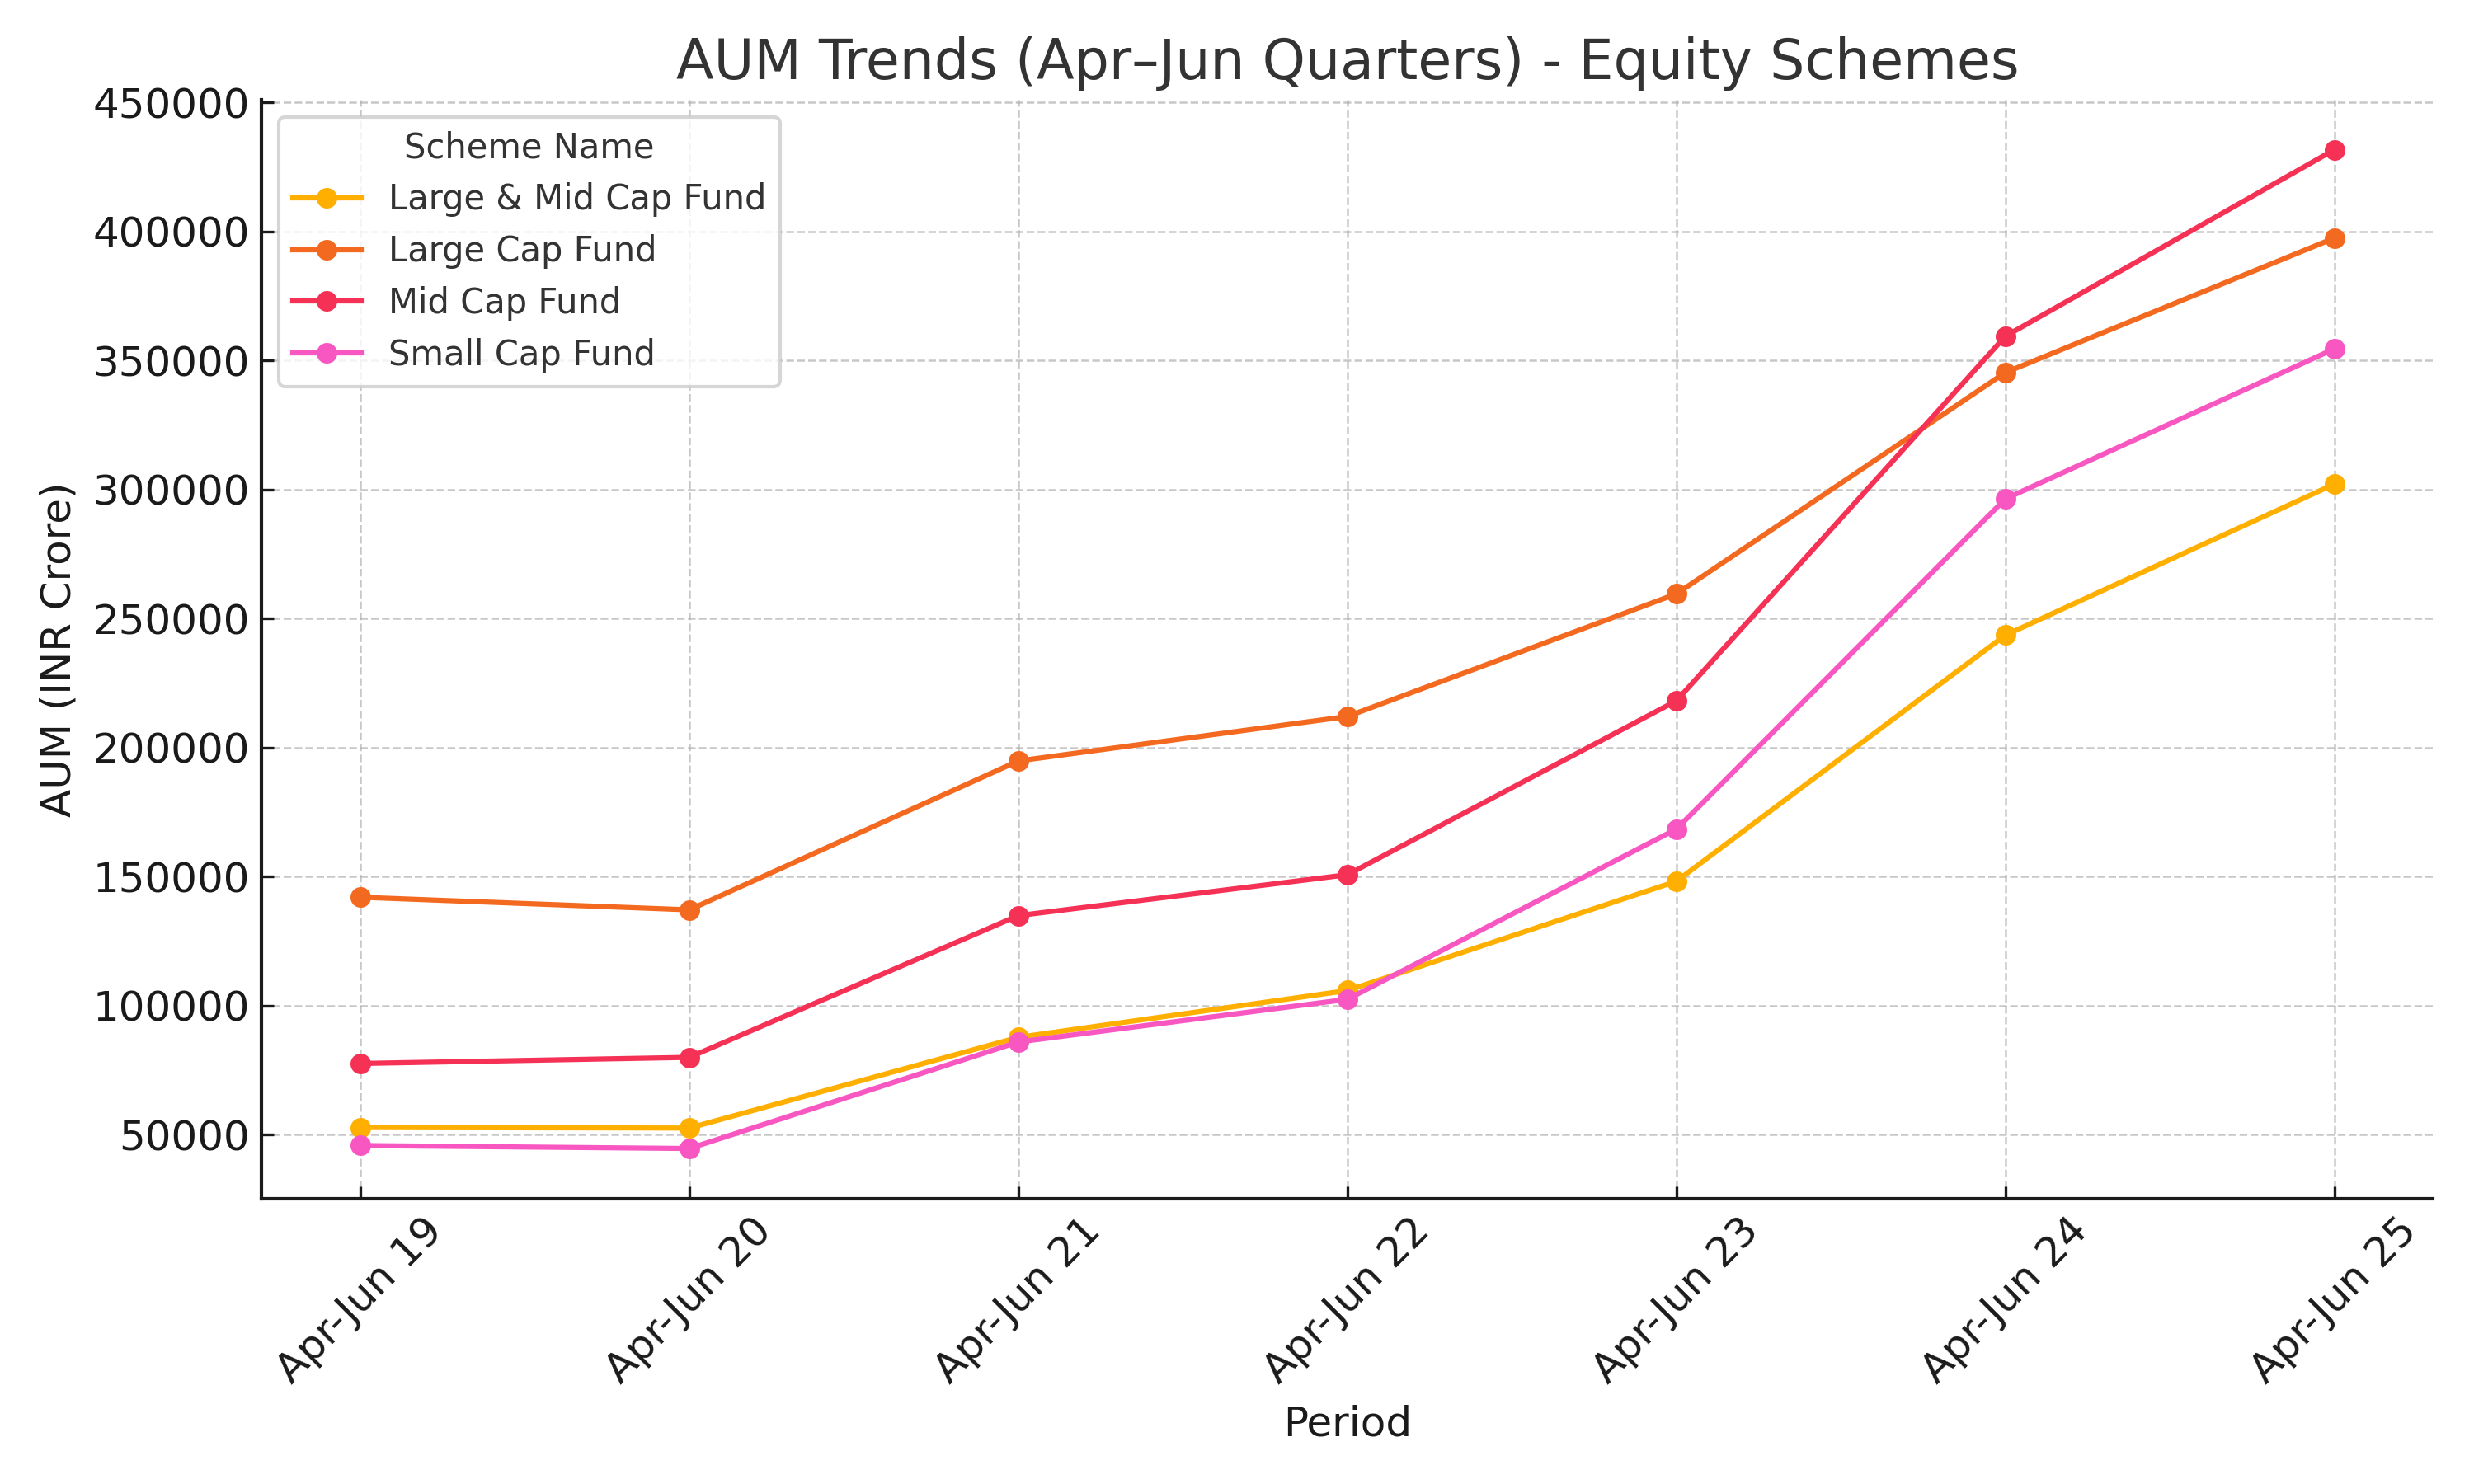
- Large Cap Funds consistently lead in AUM, anchoring portfolios.
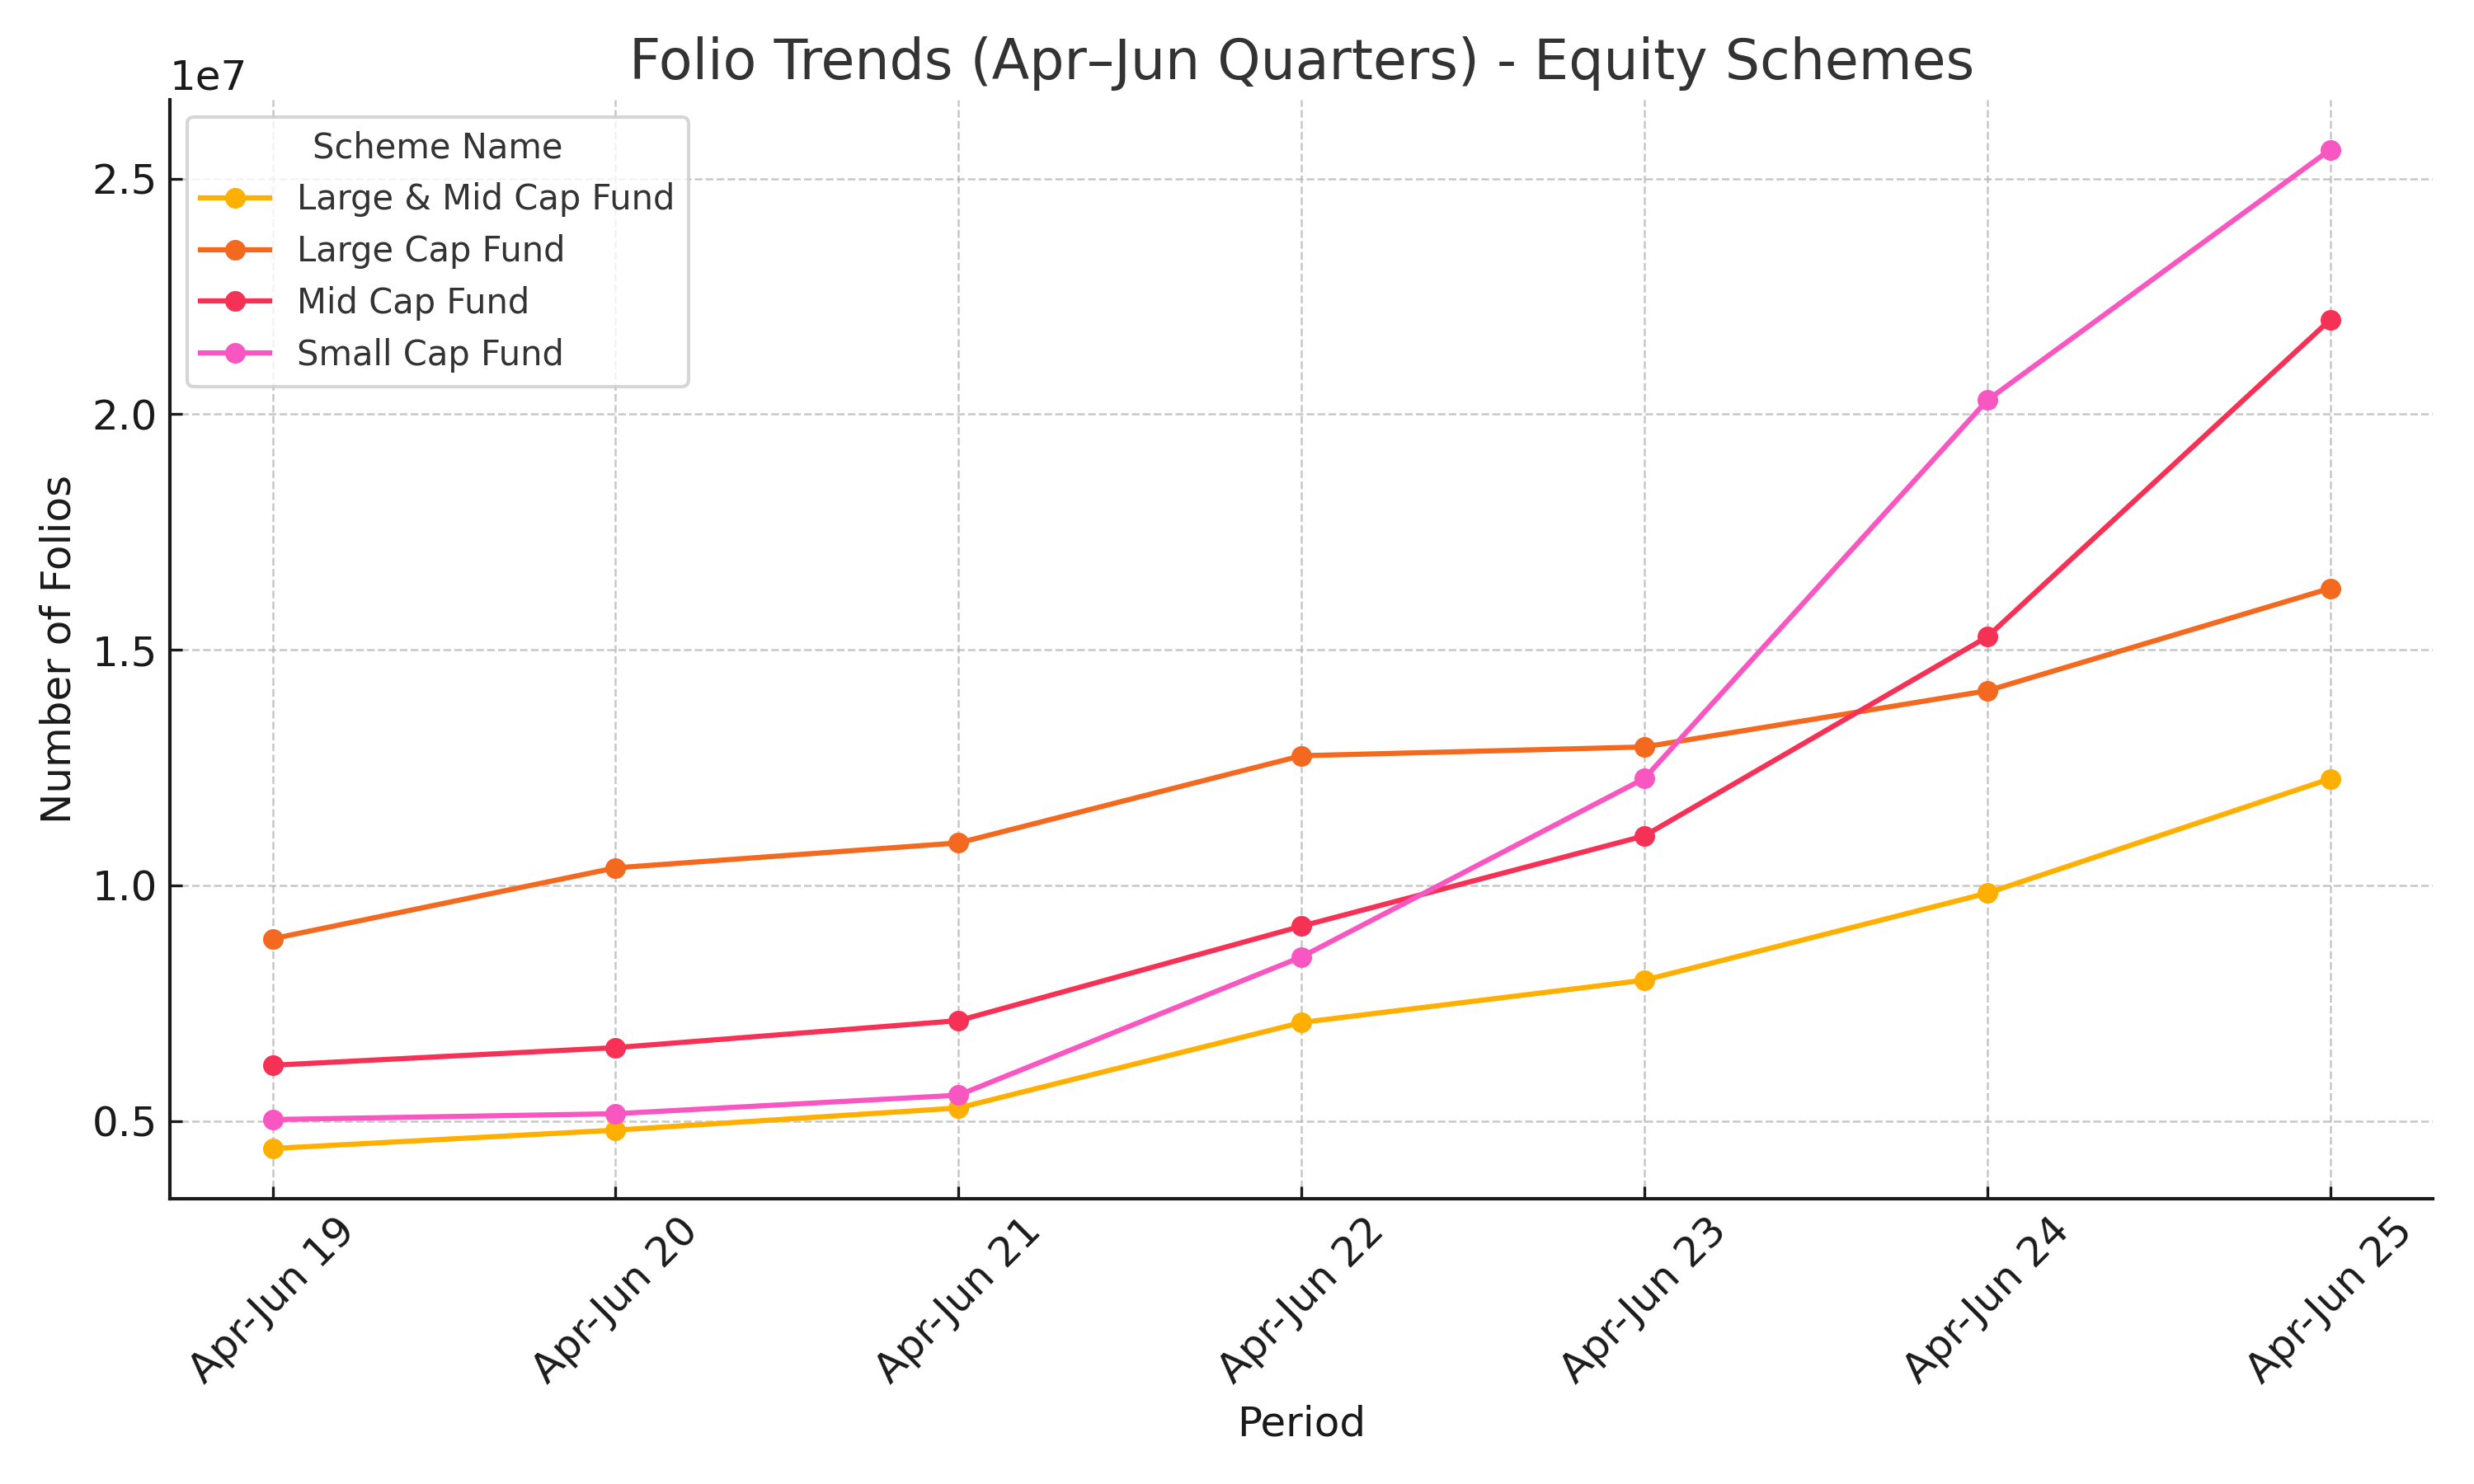
- Mid and Small Cap Funds show sharp AUM surges in bullish Apr–Jun quarters, often outpacing Large Caps in growth rates.
- Large & Mid Cap Funds offer a balanced allocation, but adoption remains modest compared to pure mid/small cap plays.
Psychology of investors
Each scheme type maps onto a risk psychology spectrum:
- Large Caps → Stability bias: investors prefer blue-chip safety in volatile markets.
- Large & Mid Caps → Compromise bias: chosen by those balancing stability with growth.
- Mid Caps → Optimism bias: chosen when investors extrapolate strong past performance into the future.
- Small Caps → Herd behavior & greed: surges of retail money flow in during euphoric phases.
These patterns mirror well-known behavioral finance biases such as recency bias and herd mentality.
Data insights
Looking at YoY % changes in Apr–Jun quarters provides sharper insights:

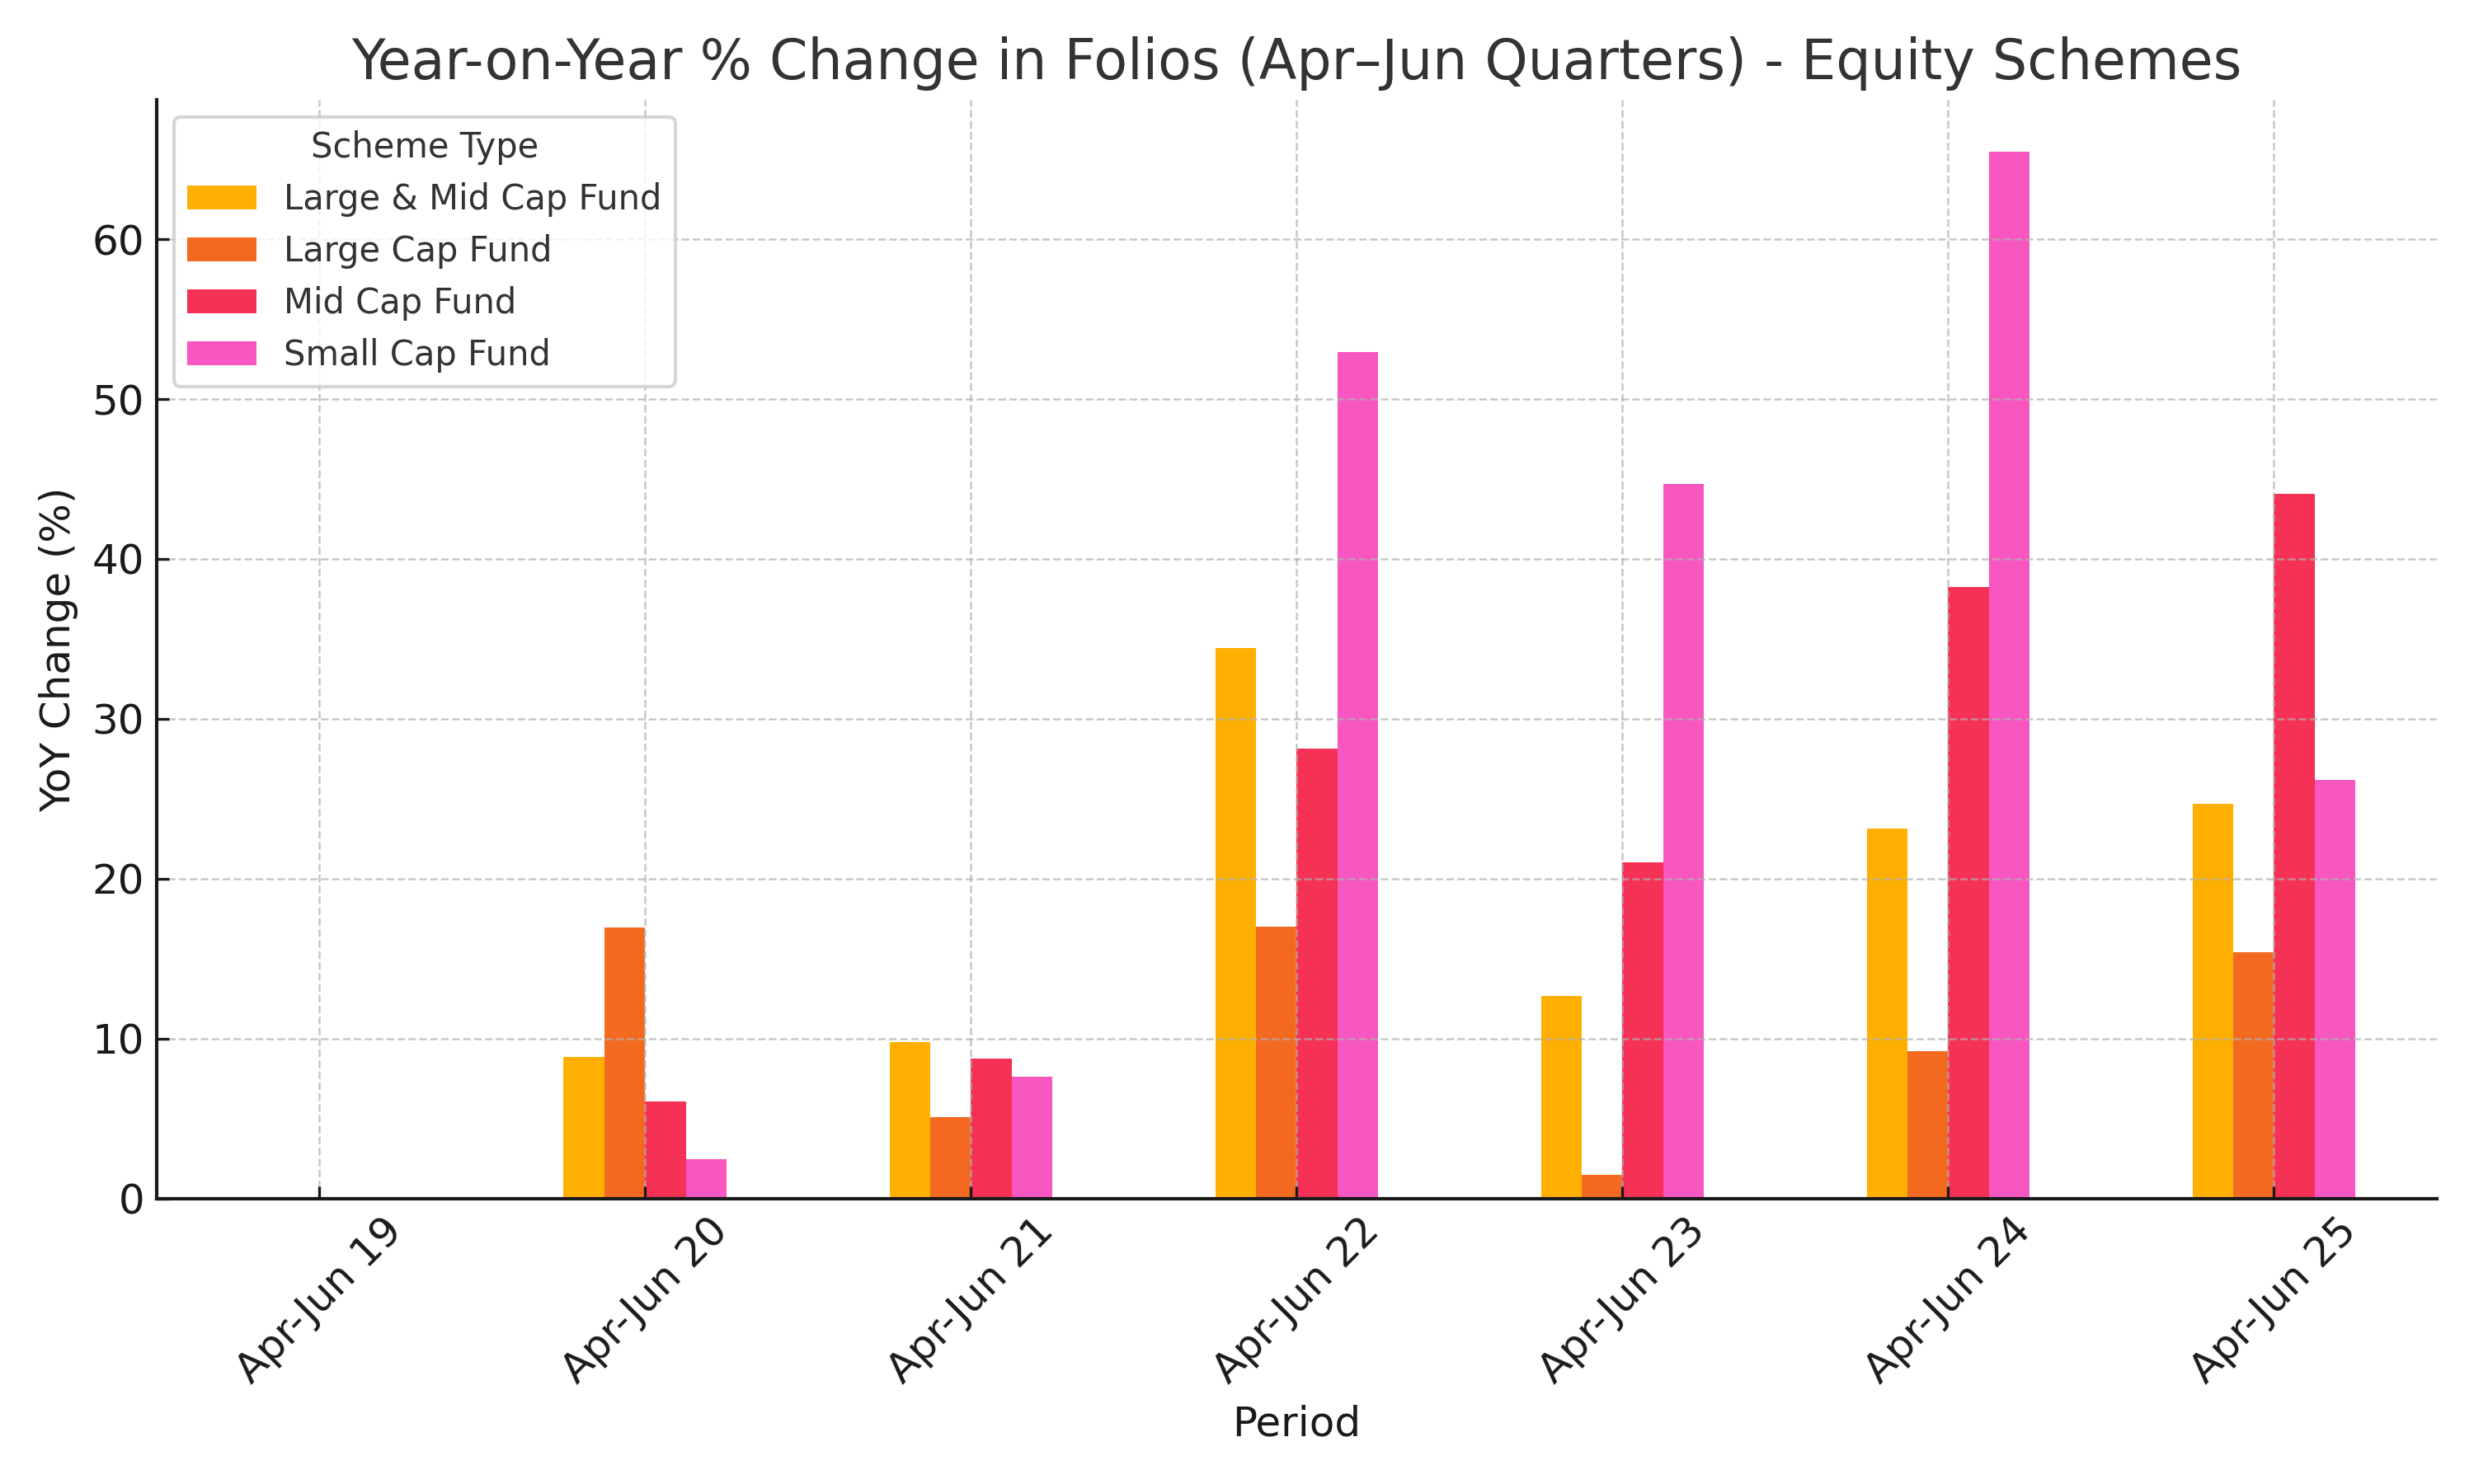
Key observations:
- Large Caps: steady, low-volatility growth in both AUM and folios.
- Large & Mid Caps: modest but consistent adoption.
- Mid Caps: cyclical — strong in bull markets, vulnerable in corrections.
- Small Caps: fastest-growing, but prone to herd-driven swings.
Implications & investor takeaways
- Retail investors should be cautious of herd-driven entry into Small Caps late in the cycle.
- Mid Caps are powerful wealth creators but require higher risk tolerance.
- Large Caps remain essential as portfolio anchors.
- Data-driven monitoring of AUM and folio trends can serve as sentiment indicators, warning investors against overheated phases.
Closing thoughts
The Apr–Jun quarter data reveals that Indian investors are not just chasing returns but allocating strategically across risk categories.
- Markets dictate cycles.
- Psychology explains allocation shifts.
- Data reveals patterns that help investors act with clarity.
As India's investor base matures, the key challenge will be resisting herd instincts in Small Caps while maintaining long-term conviction in equities.
Educational content, not investment advice.